Have you ever watched my videos or used them in class and wished there were aligned practice questions to go with them?
I’ve been working the folks at PositiveSTEM (a.k.a., Positive Physics) to develop a FREE review unit on the muscular system. To use it with your classes, just go to www.positivestem.org and sign up for a free account!
Basically, we took my muscular system videos and created questions that go along with each video. The questions are divided into skills, some of which build on each other. (E.g., one skill might have students label the sliding filament model, and the next skill has them explaining the process.)
Here’s a webinar we did to demonstrate how the platform works and what the questions look like.
Benefits of the PositiveSTEM platform
The PositiveSTEM platform is great for this kind of review for several reasons:
It gives students immediate feedback on their answers.
It allows teachers to track student performance. Teachers can see an accuracy score (% of questions answered correctly on the first try) and a completion score (% of questions answered correctly after any number of attempts).
It’s aligned with my videos. If you already use my videos in your classroom, this would be a perfect fit! And it not, the videos are embedded in the “Lesson” section of each skill, so students can go back and watch the video if they need to learn the content or get a refresher on it.
Here are a few images of the interface. First, students choose (or a teacher can assign) which skill they are going to practice. This brings them to the video lesson and a set of questions for that skill. (Each video covers multiple skills.)
Students submit answers through drop-down menus as they progress through question sets. They get immediate feedback on whether their answer was correct. And teachers can track all of this through their own dashboard.
The Content Covered
This review unit currently covers the concepts from my three muscular system videos. This covers everything from movement terms, identify major superficial muscles and their antagonists, and explaining the sliding filament model. The full list of skills covered is listed under each video here.
Muscles & Movement
Applying Movement Terms
Identifying Muscles
Muscles & Movement
Origins & Insertions
Antagonist Pairs
Muscles Practice
Skeletal Muscle Levels of Organization
Types of Muscle
Levels of Organization
Sliding Filament Model
Labeling Excitation-Contraction Coupling
Explaining Excitation-Contraction Coupling
Labeling the Sliding Filament Model
Explaining the Sliding Filament Model
And here are some screenshots of the types of questions found in the problem sets (click images to enlarge):
And most importantly…
This is all free!
Next steps for the Positive Anatomy & Physiology course
At the moment, we’re trying this unit out to get feedback and gauge interest in a full A&P course. If all goes well, we’ll create the rest of the units throughout the ’24-’25 school year and keep the course completely free during that time. Then after that (’25-’26 and beyond), it would be a paid subscription. (My school currently pays for the Positive Physics course, and I use the Positive Chemistry course with my AP classes, and I think the prices are reasonable. There’s also a pay-what-you-can option if your school doesn’t have the funds to pay for it.)
We hope you find this resource helpful! And please leave us feedback on how we can improve it.
+A&P Demo Webinar
Here is a webinar we did demonstrating the muscular system review unit. Check it out to see what how the interface works and what the questions look like.
If you don’t know what Patreon is, it’s a way to financial support creators and receive perks in return. If you’ve benefitted from my videos or other resources and want to support my work through a monthly contribution, now you can!
I have three tiers on the Patreon, which are themed around three levels of organization in anatomy. I spent way too long on the little animations…check them out below! (along with the perks for each tier!)
Video study guides
Behind-the-scenes updates
Discord access
Benefits from previous tiers
Voting access for which videos I should make next
Your name on my website and future videos
Benefits from previous tiers
Monthly Google Meet hangouts where we talk A&P or review concepts you need to learn!
The most-requested perk was study guides to accompany my videos. I have a few made so far, and I’ll be added study guides for all new videos that I produce, plus creating some for some of my most popular videos.
Here is a sample study guide from my Digestive System video. The study guides include video notes plus practice exercises and study techniques to help you learn the content!
If you’d like more information, check out my Patreon launch video:
And here’s my fun “about me” description from the Patreon page:
Welcome to the Siebert Science Patreon!
My name is Justin, and I create videos to help people learn about the human body. The human body is awesome. Video production is awesome. You are awesome*. Needless to say, I love working on this channel. Thank you for being part of it!
I’m a high school science teacher, which makes me a lot like an enzyme. I’m used to taking big, complex topics (macromolecules) and breaking them down into simple chunks (absorbable monomers) that everyone can understand. The first ~120 videos I made were for my own students, but millions of people have seen them at this point: high schoolers, college students, medical and nursing students, and lots of life-long learners who just want to know more about how our strange and wonderful bodies work.
Of course, I’m one person. I have a full-time job and a full-time family. And making quality videos takes a ton of time and effort. By joining the Siebert Science Patreon, you not only get some great perks (video study guides, private Discord where you can ask me questions, voting on what videos to make, behind-the-scenes content, shout-outs in videos and my website, and monthly online hangouts) but you also get to be part of this channel and help millions of learners around the world learn anatomy & physiology.
You rock. Thanks for being here.
—–
*You may wonder how I know you’re awesome even though I probably don’t know you personally. First, you found my Patreon page, which means you probably (a) love to learn about the human body and (b) are potentially interested in helping me help others learn about the human body. Second, you are a human (again, assuming here), and just being alive is stinkin’ amazing and wonderful and brief. So yeah: awesome.
So yeah! Thanks for your support, whether or not you’re able to give financially through Patreon. I appreciate you being here. Keep learning!
In the online AP Chemistry teacher community, the assigning of summer work is a bit of a controversial topic. Some adamantly opposed, some saying it’s necessary, some using it as a way to weed out students who won’t do the work.
Since I started teaching AP Chemistry 6 years ago, I’ve given summer work each year, and I think I’ve improved it each time. At this point, I have my own videos, my own problems, my own answer keys. I also think I’ve struck a good balance of making the assignment manageable for students. Do some chem this summer, but still enjoy your summer!
In the revising of these assignments, I’ve always held these things to be true:
I will not assign busy work. I don’t want to waste my students’ precious summer time.
The summer work should be relevant to their success in the class and on the AP Chemistry exam. The work needs to reinforce some basics of first-year Chemistry as well as push them to learn some new things.
They need to receive timely feedback on their work. Without this, the summer work may reinforce misconceptions and work against their understanding of chemistry.
The focus of my summer assignment is really on two things: stoichiometry and ways to represent reactions (specifically net ionic equations and particulate diagrams). Particulate diagrams are pretty heavily emphasized on the AP Chemistry exam, and I think this is overall a good thing. I’ve also found that students who really struggle throughout the year come in with deficits in math and stoichiometry.
My students have four separate due dates, one for each assignment. Upon submission, I give them typed feedback and require them to redo problems they’ve missed. I also (starting this year) will have some summer office hours for them to come get help if needed.
I just added this section this year. My students tend to struggle with solution stoichiometry more than other stoich conversions, and they’ve never done dilutions, so this felt like a needed addition.
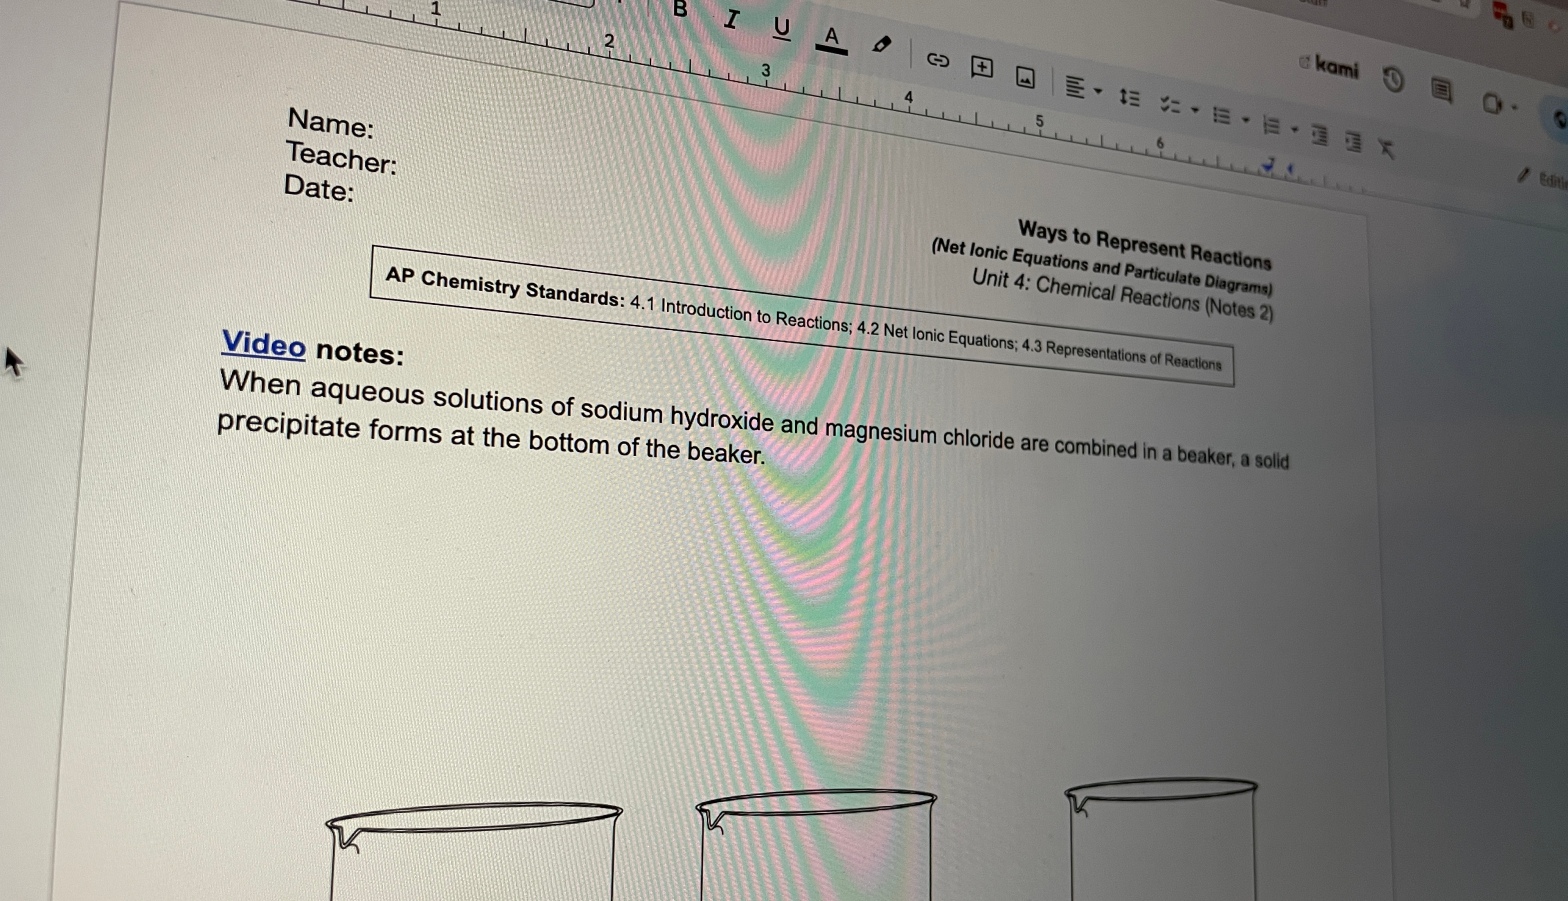
Particulate diagrams and net ionic equations. In this assignment, I’m focusing on what is really happening during a reaction. Get rid of those spectators!
In the first video, I talk through all the possible conversions. In the second, I do three example problems. With the exception of moles of reaction and heat of reaction, everything here is review from first-year Chemistry, but it’s definitely content everyone needs more practice in.
This is usually all new content for my students. We start the year with practice from all of these assignments, but I try to focus on limiting reactant a bit, since it’s new and pretty challenging at first.
If you teach AP Chemistry, feel free to use any and all of this assignment!
Here’s the activity itself! Below is my commentary and explanations.
Maxwell-Boltzmann distribution graphs are a way to represent the varying speeds of particles in a sample of gas. They are often tested on the AP Chemistry exam, and they get at the heart of a few important chemistry concepts:
Particles in a sample of gas don’t all have the same speed.
Gases at a higher temperature will have particles moving, on average, at faster speeds.
Heavier (more massive) particles, at the same temperature, will move slower. (from the KE = 1/2mv^2 equation)
The basics of kinetic molecular theory
In previous years, I’ve used some good resources to teach Maxwell-Boltzmann Distributions, including the POGIL activity on the topic, a few videos I’ve found online, and the PhET Gas Properties Simulation. But I’ve never felt great about my students’ understanding of the graphs afterward. They usually can draw them, but they often don’t really get what the area under the graph means or why the peak is lower when you shift it to the right.
So I thought, “What if students could start with some (made-up) data and create the graphs themselves? What if they could see exactly where the shape is coming from by plotting it out themselves?”
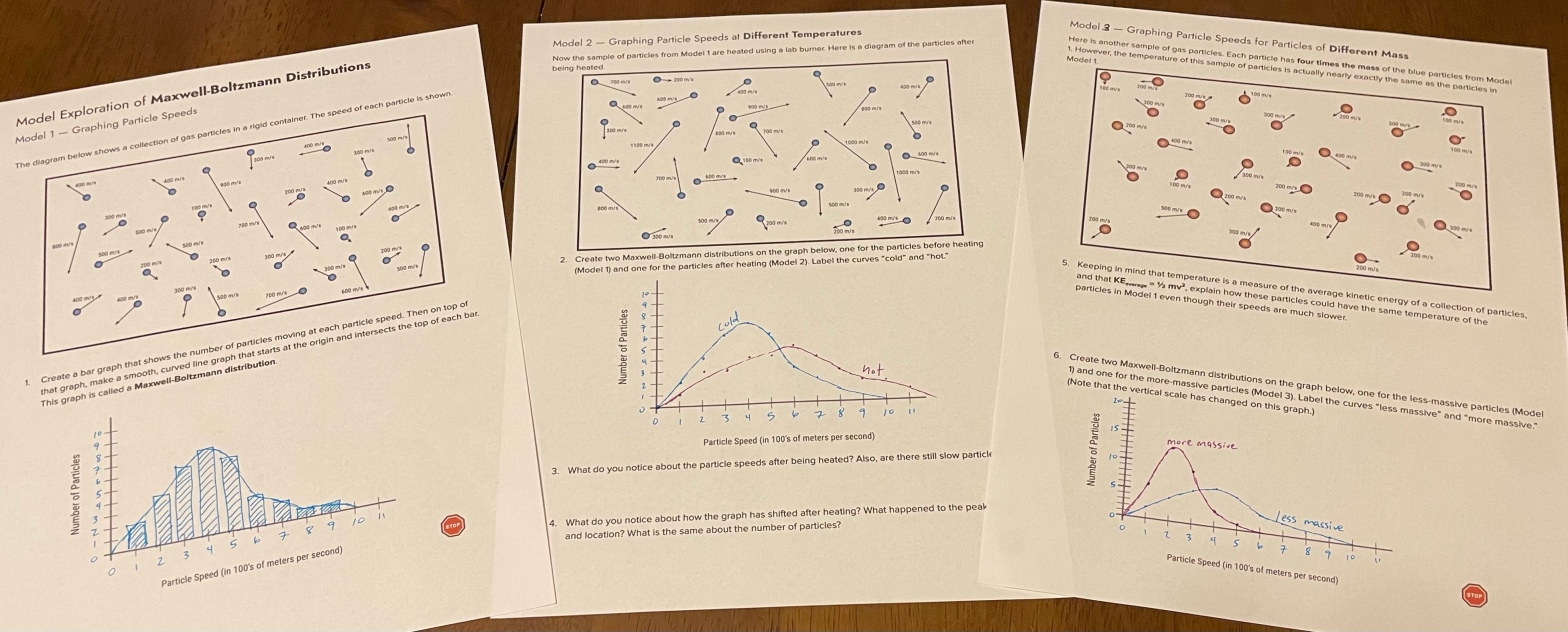
I created a model exploration activity where students could create their own Maxwell-Boltzmann graphs.
In the first section (Model 1), they count how many particles are moving at each speed, then graph it. I specified bar graphs on this because it sort of gets at the idea of the area under a curve (which my students won’t really learn about until calculus next year).
In Model 2, I show the same sample of gas after it has been heated. Students repeat the process, showing both curves on the same graph so they can see how the graph shifts at higher temperatures.
Model 3 shows a sample of a different gas, which has a greater mass, but the same kinetic energy. Here I introduce the idea of the relationship between mass and velocity (at the same temperature). Heavier particles move slower (on average). They draw the Model 1 and Model 3 samples on the same graph and see how the curves shift for gases of different mass.
Finally, because the PhET simulation for this is just so good, I have them use the simulation to verify the graphs they’ve made and look for other patterns.
Also, here’s a video I made a while back on the effect of temperature and catalysts on reaction rates using Maxwell-Boltzmann distributions, which I use later on during kinetics:
With my Bohr model cards being a hit, I wanted to create something fun for mass spectrometry. Unfortunately, some mass spectra are hard to find or not labeled exactly the way I want, so I made my own. I used a Google spreadsheet to input the percentages for each isotope, then added the graphs. The resources I created are here:
The spreadsheet I used to make all of these (Note: I had to fudge some of the numbers a bit to make all the columns show up on the graphs. This is for classroom purposes only!)
And the rest of the post is a summary of how I used them.
The Lesson
I started with a pretty standard lecture on mass spectroscopy: what it is, how the machine works (suuuper basic overview), what a mass spectrum looks like, and how to interpret it. I gave them one example question to work on with a partner. They had to identify which isotope was the most abundant, which isotope had the most neutrons, and then identify the element.
While they worked on this, I spread out my mass spec cards in the back of the room (I have a very small AP class). I printed three copies of each of the 7 cards in this initial set. Why did I pick these particular 7? Basically, I was on a time crunch before I had to teach the lesson, and these were all I got to. It wasn’t necessarily optimized.
I intentionally did not include element names on the cards. That way students could practice identifying the element based on the graph.
Here are some of the questions I asked my students:
Find the mass spectrum for the element with the most isotopes. (There were two possibilities: selenium & krypton)
What is the identity of this isotope?
Find the mass spectrum for carbon.
Find the mass spectrum for the element with only one isotope.
Find the two mass spectra for elements with an atomic mass of slightly below 80. One is bromine and one is selenium. How can you tell which is which?
Find the isotope with the most number of neutrons.
As I asked each question, students walked around trying to find the mass spectrum that answered the question. It got them up and moving, which is always good. It was fun for them, but also fun for me as I tried to think of new questions to ask.
Another idea is to just spread them around and have students try to identify each element.
Full Set(ish) of Mass Spectra
I have a complete set of cards now for elements 1-36. Okay, I guess it’s not “complete” per se, but I don’t plan on adding the rest of the naturally-occuring elements.
I won’t print all of these when I teach this again; that would be kind of overwhelming for students. I would pick and choose the ones I wanted to use and just print those. If you’re planning to do this, feel free to make a copy of the slides, delete the cards you don’t want to use, then print from there.
So, there you have it. Nothing too revolutionary. But it made for a fun way to practice their mass spectrum interpretation skills!
Nothing motivates me to create new teacher materials more than a failed lesson. After this year’s first lesson about periodic trends and Coulomb’s Law ended in blank stares when asked to explain why atomic radius decreases across a period, I knew I had to do better for my AP Chemistry students.
Here is what I came up with. Feel free to use any of these resources in your classes!
The rest of this post explores the process of creating the materials and how I used them in class.
Creating the Bohr Model Cards
In the initial lesson, I had students draw their own Bohr models to explain the trends, but their understanding of atomic structure wasn’t at a point where they were ready to make strong connections with these. They could create basic Bohr models, but the process was slow.
Instead of students drawing the models, I wanted them to be able to quickly reference and compare the models, looking for patterns and trends. I wanted something they could manipulate and rearrange. There are other printable Bohr model cards out there, but nothing quite fit what I wanted.
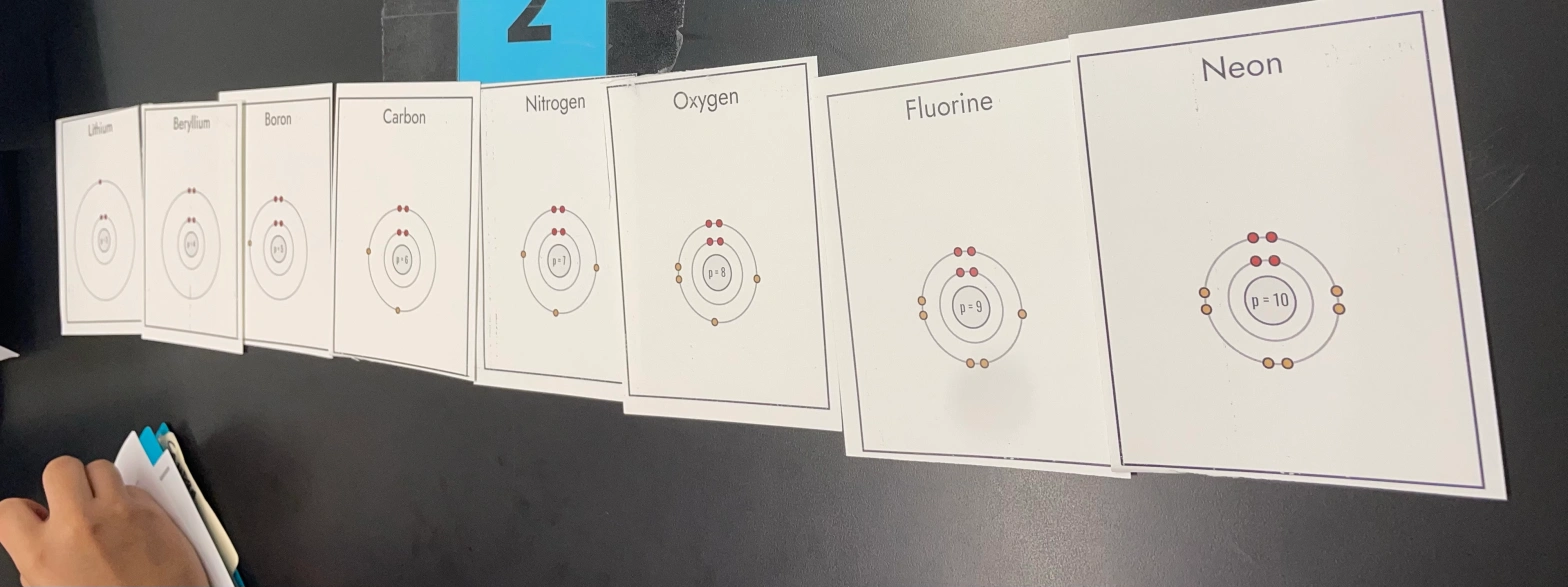
So I created these cards in Google Slides, being careful to make sure the atomic radii (sizes) of each atom is correct relative to all the other atoms (though not truly to scale). With some helpful input from chemistry teacher Melissa Hemling, I edited it to make sure the inner electron shells always get smaller as the number of protons increases. I also color-coded the electrons to show orbitals, and made sure the cards went up to scandium to show one d-orbital electron.
I printed the cards on the “4 slides per page” setting, which worked well. Feel free to make a copy of my Bohr model cards to print for your own classes if you’d like!
With the cards made, next I needed some structure for my students to follow in order to make the connections I wanted them to make.
Creating the Model Exploration Activity (fake POGIL®)
So, POGIL® already has an activity for periodic trends and Coulomb’s Law, but I specifically wanted something to get them using the Bohr model cards. I also wanted a focus on how to explain the trends using Coulomb’s Law on AP free response questions. So I made my own!
Side note: If you don’t know what POGIL® is, it stands for “process-oriented, guided-inquiry learning.” This method of instruction starts with visual models, then has a list of questions that guides a group of students through the process of understanding the model.
Here’s the general structure:
Model 1 – Coulomb’s Law – For any of this to make sense, students need a good foundation of Coulomb’s Law, which basically states that a greater charge and a shorter distance between particles results in a stronger attractive force between those particles. I made a diagram of a nucleus and an electron to show this, with an equation included to help students make connections with the mathematical relationship.
Model 2 –The Shielding Effect and Effective Nuclear Charge – This basic idea here is intuitive: protons attract the valence (outer) electrons, but inner electrons repel those outer electrons. But the application of this in calculating effective nuclear charge is tricky, so this model guides them through the reasoning.
Using the Bohr model cards – Students set out all the Bohr model cards for one period, so they can analyze the trends across a period. They then repeat this for the models down a group.
Model 3 – Explaining the Trend – This part explicitly guides them through how to formulate a free response answer on the AP exam. By this point, they have a good understanding of the concepts, but haven’t had to put it all into sentences yet.
Model 4 – Ionic Radius – This adds a layer of difficulty because students now have to picture what happens when electrons are added to or removed from a neutral atom. The model here allows them to analyze this easier, and introduces the idea of repulsion within an energy level.
Model 5 – Successive Ionization Energies – This is almost its own lesson, but it’s an often-tested concept on the AP exam. Students find connections between boron’s ionization energies and its electron structure, then apply these concepts to another table of ionization energies.
Bohr models of Period 2 elements lined up to analyze patterns across a period. (Page 3 of the Model Exploration activity)Bohr models of Group 1 elements lined up to analyze patterns down a group. (Page 3 of the Model Exploration activity)
Orbitals on the Bohr models – One group had a debate about the colors on the Bohr model atoms, with one student sure that the colors meant something, but no one knew what. I had the group get out the scandium card, note the blue electron, and look at scandium on the periodic table. The lightbulb clicked for them shortly after, with students realizing the color corresponded to the s-, p-, and d-orbitals. These connections between Bohr models and electron configurations wouldn’t have happened without the cards.
Shielding Effect and a Misleading Aspect of the Bohr Model – One group had trouble calculating the effective nuclear charge of the atoms because of where the core electrons are drawn on the models. Students asked me, “Do core electrons drawn below the nucleus repel a valence electron drawn above the nucleus?” It was a great question. I told them the Bohr model is just a model, and it’s far from accurate. I asked them whether electrons actually existed where they are in the Bohr model, and they responded by talking about the orbitals, how an electron is constantly moving and can be anywhere within its orbital. This quickly got them back on track with the understanding that all core electrons repel the valence electrons.
These can be used for a lot more than periodic trends – In future years, I think I’ll start with these models when we first do electron configurations. No, they don’t show orbitals, but the Bohr model is so simple and helpful, them making connections between the quantum mechanical model and the Bohr model is huge. I’ll use them some for photoelectron spectroscopy (PES) because it shows why the binding energies all increase as protons are added. I think they might also be helpful for basic Lewis structures and helping students see why certain elements tend to form a certain number of bonds. Just look at the number of lone valence electrons on the Bohr model…the element will tend to form that many bonds!
Use the POGIL® role cards – I used the official POGIL® roles for the first time, and I think it’s a good structure. It also set some great norms. I got these resources (which are copyrighted, so I don’t share them online) from the book POGIL® Activities for Life Science—Designed to Support the NGSS.
This took a lot of class time – I mean, I think it was definitely worth it for this lesson because student thinking was great. But we didn’t get done with all of this even within a 90-minute block. It’s the same critique I have about the official POGIL® activities as well. There’s just not enough time to do all of our lessons this way.
I hope you found this post and these resources helpful! Click here for the rest of my AP Chemistry, Anatomy & Physiology, and Physics resources.
Before Class (introducing WASB Titration & pH Calculations)
Before my students came to class, they watched this video I made and took notes on this notes sheet. In the video, I do pH calculations at six different points along the titration curve, plotting each point as I go.
It’s…a lot. But the nice thing about using this video is that ALL of our class time on this topic is now them practicing, rather than me taking up multiple class periods lecturing on this.
At this point, my students have seen all the calculations, but not tried them themselves. And they’ve seen particle diagrams for SASB, but not for WASB or WBSA. I also forgot to include the idea of a “buffer region” in the video, so I briefly go over that in class.
Introductory Activity – Michael Farabaugh’s Practice
I started class by having students complete this matching activity in their groups. Farabaugh has a video explaining all of this, but I found that my students could successfully complete the matching section without it. (The writing activity that Farabaugh has posted would have been a challenge though).
The Task – Graphing the WASB Titration Curve
I got this idea from AP Chemistry teacher Rafael Betancourt on the AP Chemistry Teachers Facebook group.
As soon as students started finishing the matching activity, I presented this task (also embedded below), but with considerably less silly fanfare than my SASB activity.
The startup costs for this were about $50 because the giant, 2′ x 3′ pads of graph paper are really expensive. Luckily, we only used four sheets of it, so I’ll be able to keep using the pads for years to come. I got 0.75″ diameter colored stickers, which worked well. I wish I’d have gone with the 1″ stickers though, so they could have enough room to write the ion symbols directly on the stickers instead of relying on the key.
Students got right to work. I imagined they would lay the paper on their lab tables, but all four groups taped the graph paper to their vertical whiteboard. They’ve really taken to the whiteboard format, even when I don’t prompt them to. I love it though; they collaborate super well when at the boards.
The results are below. You can move the slider to compare what the projects looked like at the end of the first day and at the end of the second day. What I love most about this is that it encompassed nearly all aspects of the titration curves: pH calculations, the graph itself, important points like equivalence and 1/2-equivalence, and particle diagrams.
Some great collaboration within this group of two students.
This group struggled the most, but they also had the most challenging titration (WBSA). Still, we were able to address a lot of misconceptions, even if the calculations weren’t quite there.
Student Misconceptions Uncovered
As a teacher, it can be disheartening when misconceptions like these crop up (did I not teach this clearly enough???). But in reality, part of the point of tasks like this are to bring these misconceptions to light, name them, and help students correct them. So with that mindset shift, here are a few uncovered student misconceptions that are worth celebrating.
Net Ionic Equation is the same as SASB – One group had their net ionic equation written as H+ + OH– = H2O. They had separated the weak acid HA into ions on the reactant side and canceled A– on each side as a spectator.
H+ included in particulate diagram in the buffer region – HA dissociates into H+ and A– as the acid is titrated, but the H+ that is produced is immediately neutralized by the OH–, becoming water. A couple groups were including those hydrogen ions. I pointed out the N.I.E. for the titration, showing there were no hydrogen ions produced. It felt wrong to at least one student that there were then fewer ions in the particle diagram, so we talked about how those atoms are still there, but not they’re part of water molecules, which we’re not including in the diagram.
Equivalence point pH not in the middle of the vertical section – You can see the mistake in the “before” image of the first titration curve above. The group plotted the equivalence point, then had the graph going immediately up and to the right, instead of continuing upward before curving over.
Difference between neutralization and dissociation – One of my groups was conflating the two of these, which led to a lot of difficulty in their calculations. I’m glad we had the chance to get this straightened out, since it’s pretty essential to everything in this unit.
Reflection
Afterward, I asked a few students if they thought I should do all this next time I teach AP Chemistry. Once student replied that she thought it was worth it, even though it took a long time.
And that’s my main concern. This took two full 90-minute blocks. Overall, I think it was worth it. Between exposing misconceptions, getting practice with particle diagrams, practicing all the calculations, and comparing these curves with the SASB titration curves, there was (hopefully) a lot of learning going on.
Either way, it was definitely better than past years when I’ve just worked through the calculations in front of them and not saved time to practice.
The Case of the Missing Data and the Dishonest Chemistry Students!
In the past, I’ve lectured on this SASB titration pH calculations, then because of time constraints, students had little to no time to actually practice it themselves. This year, I finally got around to creating a flipped classroom video of how to do these calculations, which freed up time for me to actually have them do something with it!
Before Class (introducing SASB Titration & pH Calculations)
Before my students came to class, they watched these two videos I made and took notes on this notes sheet. The first video introduces what titrations are and show particulate diagrams at each stage. The second video shows how to calculate pH at each stage of the titration curve. After watching the videos, students had an idea of how to all of this, as well as a record of it in their notes, but…it’s a lot. They still needed (of course) a lot of practice.
This is a video I made back in 2016. I think my video skills have improved a lot since then…
The Assignment (The Case of the Missing Data & the Dishonest Chem Students)
I immediately started class by presenting this task, also embedded below.
The basic premise is that they had all this titration data from a lab last week, but they lost the Vernier Graphical Analysis file and now have to create some fake data to fool their unsuspecting teacher.
Pretty silly, but I played it up a bit, going as far as putting the base volume on a sticky note in one member of each group’s lab book, pretending they wrote it themselves.
The purpose of this task is to get students creating the titration curve and doing all the pH calculations themselves. Instead of a list of problems, they’re doing the calculations in the context of the titration curve as a whole, creating as many data points as possible in the ~1 hour they had to work on this.
Student worked in small random groups of about 3 or 4 at vertical whiteboards (a la Building Thinking Classrooms principles, which I use in my classes) to calculate the initial acid molarity and the pH of points along the graph.
This group, which calculated the most data points, used the same Before/Add/After table and just kept changing up the numbers. It was a great way to sort of automate the process and get quicker results.
Results
Here are the graphs that each group produced. I was pretty happy with it overall. The first group, at least, could have fooled me with their graph, haha!
This group rocked it. They found pH every five mL, then went back and added some more points near the equivalence point to show how that section curves.This group did pretty well too. Something went wrong in their calculations past the equivalence point, but we ran out of time to figure out what the mistake was.This group took the longest, but they at least got practice calculating pH. I’m not sure why they didn’t include the equivalence point pH of 7, but I’ll follow up with them next class.
I’ll definitely do this again next year. The main thing I’ll change is to have them include a particulate diagram at each stage of the titration curve.
If you haven’t heard me talk about it enough already, some friends and I made a book! It’s a Memphis-themed anthology called Malfunction Junction: Memphis Stories of Stops, Starts, Wrong Turns, and Dead Ends. You can buy copies at Novel (see photo of Alondra and I posing in front of the display below), and we’ll be signing copies and talking about the book at our author event on January 15th at 2:00 pm.
Also, if you come to the event, we’re going to have a special bonus (scroll to the end of this post to see what it is!).
This post is all about the cover design for the book, which you’ve seen. But the road to getting this final cover design was its own journey of stops, starts, wrong turns, and dead ends.
Pick me! Pick me! Pick me!
In the past few years, I’ve discovered (rediscovered?) my interest in art and design.
So when Daniel (head honcho of this anthology operation) asked if I wanted to work on the cover design, I jumped at the opportunity. I really wanted this project to have an excellent cover, and self-published books aren’t necessarily known for having the best cover design.
I got right to work.
I spent a few hours playing around with different designs and effects with Procreate on the iPad. We wanted to incorporate a map of Memphis as well as roads because of the loose theme of the anthology.
But all I came up with these were these hot messes…
I gave up on the first two midway. The design on the right was a crossroads for me, if you will. I knew the design wasn’t working. But I couldn’t explain why it wasn’t working. I’d reached the frustrating point where my tastes far exceeded my current skill level, and I was ready to give up.
I told Daniel maybe we find someone else to do the cover. I hear $30 can go a long way on websites like Fiverr. But Daniel said he thought we could do this, and that last design wasn’t all that bad. (I still thought it was pretty bad though.)
The breakthrough came when I made the roads as rectangles instead of hand-drawing them. I also got some great feedback from Justin Wells, a former student of mine who graduated at Memphis College of Art and is an amazing artist and graphic designer.
That’s how we ended up with this draft of the front cover. See below for the time lapse of my Procreate file! You can follow along with all my experimenting.
What about the Spine and Back Cover?
The what and the what?
Oh.
Right.
Um, well. Oops. Okay, I didn’t think this through.
Here was the problem. We had a cool front cover, but those roads I made needed to extend over the spine and the back cover (at least, that’s how I wanted it to be). Also, the dimensions were off. Since I had just been experimenting originally, I didn’t pay attention to the actual dimensions our book would be. Making all these changes in Procreate was going to be harder than it would be to start over and recreate the. whole. thing.
So that’s what I did.
That went a little quicker because I was mostly recreating what I had already made before. We added some text on the back, a publisher logo, and all the other important cover elements. You can see in the time-lapse that I created the design on top of the template from Ingram Spark (the printer) to make sure everything lined up perfectly.
Actually uploading this was a whole other ordeal, the trauma of which is still too fresh to talk about…
Okay, it wasn’t that bad. But it involved me fumbling around in Adobe InDesign, Daniel fumbling around in Ingram Spark’s online cover program, and lots of frustration because the process is incredibly convoluted and unclear. But we eventually got it.
Wouldn’t it be cool if we had…bookmarks!?
Rae Harding, a friend and fellow contributor to the anthology, had the idea (and a coupon or something?) to get bookmarks printed. I gave myself a little more creative freedom with these, and I ended up with a design I liked as much as the cover itself.
We’ll be giving these out at our author event at Novel. bookstore on January 15th! Hope to see you there!
If there was one class I thought I’d never want to teach…it’s English. Reading was kind of boring, writing was a lot of work for little gain, and grading papers…no, no, no, no. Yet, here I am entering my 10th year of teaching at Collegiate, and I’m about to teach a section of high school English.
How did it come to this??? Let’s start back in high school…
Reading in High School
We read books like The Stranger and As I Lay Dying and The Scarlet Letter and the play Julius Caesar. All teacher-chosen books, and all excellent works (from what I’m told) of historical fiction literature by dead white men. But not books I was likely to ever get excited about. Falling in love with reading and becoming a life-long reader was not going to happen.
I never once (in high school) got to read a book of my choosing for class. I was a student, but I didn’t get to be a reader, someone who chooses books to read in order to learn and experience new things.
Writing in High School
We wrote research papers and literary analysis essays. I compared Denethor from Lord of the Rings (which I read in middle school…remember, I never got to choose a book to read in high school) to Willy Loman from Death of a Salesman. I made notecards for a research paper on the ethics of stem cell research (I think…I can’t quite remember). Never anything I would want to write on my own. I never saw myself as a writer.
Once, I did get to write a descriptive one-pager. I remember I wrote it about what I felt driving in my truck. I’m sure it was actually over-wordy and full of cringey purple prose, but I had fun with it and other students thought it was great. I was proud of it. I think it’s one of the only things I was proud of in high school English.
To be fair, I had great high school English teachers. Gurnow, Boyer, and Henningsen led their classes well. I have fond memories from my time in those classes, and I gained necessary skills for college. But I think the way English is traditionally taught fails too many of us.
What Made Me Want to Teach an English Class
Fast forward six years. I’ve graduated college (studying engineering so I wouldn’t have to read and write much) and am beginning a career in science education at a great school. Every day, all teachers and students in the building have this 15-minute block of time called R&R to read a book of our choosing. I’ve watched the first season of Game of Thrones on a bootleg website, and I feel a bit guilty about that, so I start reading A Clash of Kings, the second book in the A Song of Ice and Fire (i.e., Game of Thrones) series, and the longest stinkin’ book I’ve ever cracked open. And I love it. I can’t wait to get home each night to finish the chapter I’d started during R&R. I realize that all the books I’d ever really loved were fantasy. I start to think that maybe I am a reader after all.
I just never realized fantasy and science fiction were genres that readers read.
Fast forward another six years, and I get the itch to start writing my own fiction. I start working on a novel (spoiler alert, novels are hard to write). The novel doesn’t happen, but I do start writing some short fiction, entering some competitions, and even get a few stories published (which you can read here if you’d like). I start to think that maybe I’m not just a reader; maybe I’m a writer too. I’ve started developing (as Kelly Gallagher and Penny Kittle would say) my identity as a reader and a writer.
Fast forward another few years to 2020. This past year, as part of a professional development unit at my school, I read The Book Whisperer with three middle school English teachers. Yeah, a strange turn of events that I, a high school science teacher, ended up reading a book about getting students to fall in love with reading. What Donalyn Miller describes in her book—a chaotic classroom full of students reading books of their choice, recommending books to each other, surrounded by thousands of books—was so contrary to anything I’d ever seen. It was what I wished my English class would have been. It made me excited about what an English class could be.
Then rumors emerged about a revamping of high school English at my school. (Credit to Thomas Pillow, Peter Bouck, and Shelia Morgan for pioneering this!) Instead of students signing up for required English 2 or English 3, students would have choices, getting to choose classes like Women’s Literature, Coming of Age Literature, Mysteries and Suspense, or Poetry. Classes would be semester-long, with fiction classes in the fall and non-fiction classes in the spring.
Just as I’d developed my identity as a reader and a writer, maybe I could help students do the same…
So I started dropping hints that I would love to teach a class on science fiction and fantasy, and people thought I was joking at first. I mean, maybe I was. It was ridiculous, but the more I thought about it, the more I wanted to share my love for SFF with a class of nerdy, SFF-loving kids. And here I am, prepping to teach it.
How This Class Will Be Different
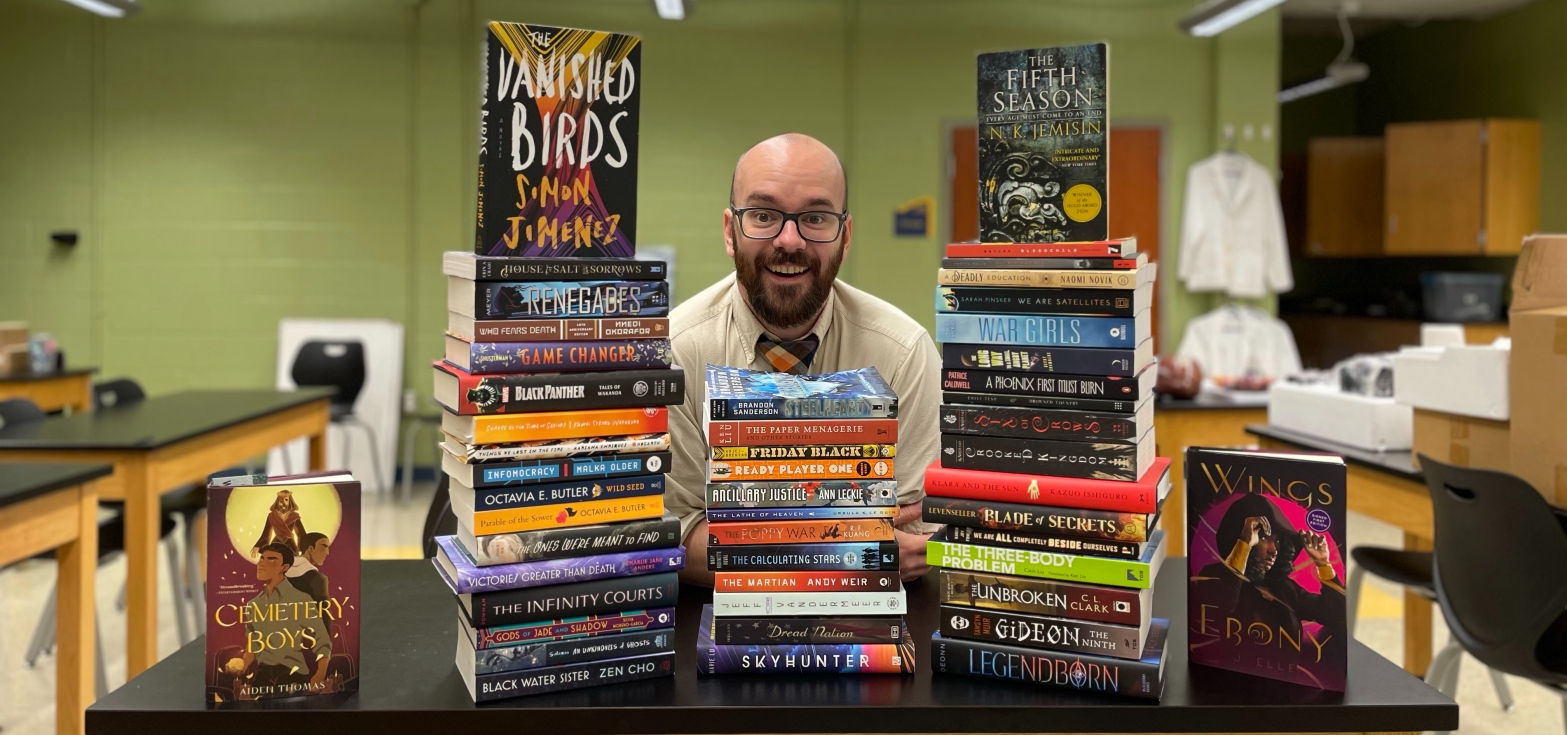
For about half of the semester, students will read books of their choosing. So I took my classroom budget from this year (being most virtual all year, I didn’t need to spend that much on science supplies), went to novel. bookstore, and bought a ton of books that I think my students might want to read. They should have plenty to choose from!
The other half of the semester, they’ll read one whole-class novel and one small-group “book club” book. My plan is to read Dawn by Octavia Butler as our whole-class novel. I think it’s brilliant, and Butler is an important author to know. So much to unpack in the book, with themes of colonialism, consent, and what it means to be human.
For book clubs, students will rank their choices from a list of five books. Then I’ll assign their book clubs, and they’ll meet with their small group each week to discuss the book. I actually did this in my Physics class last year, and it went well. I’m excited to try it again with science fiction and fantasy. Aiming for diversity in author and genre, I picked these book club options: The Vanished Birds by Simon Jimenez (my favorite book of 2020), Wings of Ebony by J. Elle, Steelheart by Brandon Sanderson, Cemetery Boys by Aiden Thomas, and The Hobbit by J.R.R. Tolkien (the book that first got me into fantasy).
As for writing, we’ll spend half the semester actually writing in the genres of science fiction and fantasy. Students crafting their own characters and stories, learning how to write narratives and learning to read as a writer. During the second half, we’ll focus on literary analysis.
This structure mostly comes from the book 180 Days: Two Teachers and the Quest to Engage and Empower Adolescents. Highly recommend.
I’ve seriously thought about leaving education several times in my ten-year career. I have an engineering degree, after all. But what keeps bringing me back are things like this. The opportunity to try something new, to break out of the mold of the way class has always been done and into something that might better serve students.
I’ll still be teaching mostly science next year, and don’t worry, I can’t see myself switching over to teaching English full-time. But I sure am excited to talk to students about SFF books and help them learn how to write their own SFF stories.